Visual Summary of Egocentric Photostreams by Representative Keyframes (Matlab code)

| Resource Type | Date |
|---|---|
| Software | 2015-02-23 |
Description
 |
This software was developed by Ricard Mestre-Subirats during his bachelor thesis in Fall 2014. Read his slides and thesis report for more details |
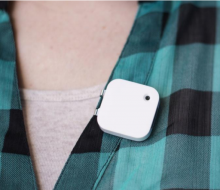
This code extracts a visual summary of a set of egocentric images captured by Narrative Clip or SenseCam. The result is a collage with one image summarizing every event of the images’ set. The extraction runs as follows:
[visualSummaryRandomWalk, visualSummaryMinimumDistance, visualSummaryRandom, visualSummaryUniform] = mainVisualSummary(path, montageFlag);
This function extracts the visual summary of all the images of the specific path.
Inputs:
-path: string containing the path of the images to summarize. Example of path: path='/imatge/rmestre/work/Images/testImages/Petia2';
-montageFlag: boolean. If it's value is true, the code will plot every event and it's representative images. This is useful if we want to extract figures with the complete events and the representative images to evaluate the results. It is recommended to put a breakpoint at the "montage(im)" line, if not all figures will overwrite the previous one.
Output:
-visualSummaryRandomWalk: a cell array containing the paths of the representative images extracted through random walk.
-visualSummaryMinimumDistance: a cell array containing the paths of the representative images extracted through minimum distance.
-visualSummaryRandom: a cell array containing the paths of the representative images extracted choosing a random image of the event.
-visualSummaryUniform: a cell array containing the paths of the representative images extracted choosing temporally equidistant images.
Once we obtain the cell arrays, we only have to execute the montage function:
montage(visualSummaryRandomWalk);
The code also includes functions to extract the Jaccard Index of the events segmentation:
[cutoff, numClusters, JI] = resultsClusterValidation(path, excel_filename, featuresMatrix, method, orderFlag, normFlag, N)
This function computes the Jaccard index along a rank of cutoff values.
Inputs:
-path: string containing the path of the images to summarize. Example of path: path='/imatge/rmestre/work/Images/testImages/Petia2';
-excel_filename: string containing the groundtruth file to analize. Example: excel_filename='GT_Petia2.xls';
-featuresMatrix: matrix containing the CNN features of the set images. The first column contains the name of this images.
-method: string indicating the method of linkage for the clusterdata function.
-orderFlag: scalar. If it is 0, the division algorithm will not be executed. If its value is 1, the temporally division will be applied, and if its value is 2 the division algorithm will be applied without taking into account the temporal information.
-normFlag: boolean. If it is true, the normalization will be applied.
-N: scalar that indicates the minimum number of images that must contain an event.
Output:
-cutoff: vector of cutoff values.
-numClusters: for the cutoff values, the related number of clusters that every value cause.
-JI: for the cutoff values, the related Jaccard index.
People involved
| Xavier Giró | Associate Professor |
Related Projects
Related Publications
|
, “Visual Summary of Egocentric Photostreams by Representative Keyframes”, in IEEE International Workshop on Wearable and Ego-vision Systems for Augmented Experience (WEsAX) 2015, Turin, Italy, 2015. |
|
, “Visual Summary of Egocentric Photostreams by Representative Keyframes”. 2015. |

